Astronauts aboard NASA’s Artemis II mission completed a key proximity operations test on April 2 while orbiting Earth. The maneuver involved controlled movements around a detached rocket stage to evaluate spacecraft handling. With CubeSat deployments ahead and a minor onboard system issue under review, the crew is now preparing for a perigee raise burn to refine Orion’s orbit.
A shoebox-sized satellite deployment and a blinking fault light now share space in NASA’s latest Moon mission update.
The National Aeronautics and Space Administration confirmed that astronauts aboard Artemis II have completed one of the mission’s earliest and most technical tests. The crew piloted the Orion spacecraft, named Integrity, through a series of close-range maneuvers around a detached rocket stage, simulating scenarios required for future docking and deep-space operations.
The 70-minute exercise marked the mission’s proximity operations demonstration. Using the interim cryogenic propulsion stage, or ICPS, as a reference point, astronauts conducted controlled approach and retreat sequences to assess manual navigation capabilities in orbit.
At the end of the test, Orion executed an automated departure burn to safely distance itself from the stage. NASA said the ICPS will later perform a disposal burn, re-entering Earth’s atmosphere over a remote part of the Pacific Ocean.

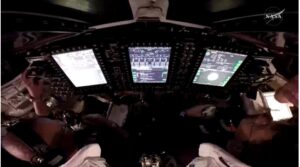
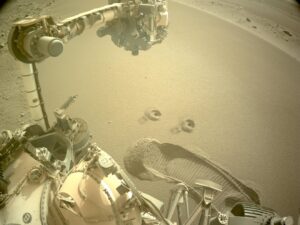
A view over the shoulders of NASA astronauts Victor Glover (left) and Reid Wiseman (right), pilot and commander, respectively, inside the Orion spacecraft as they participate in a proximity operations demonstration. This demonstration tests the spacecraft’s ability to manually maneuver relative to another spacecraft, the interim cryogenic propulsion stage, after separation, using its onboard navigation sensors and reaction control thrusters. NASA
Orion proximity operations test and orbital maneuver plan
The proximity operations test is central to Artemis II’s role as a proving mission. Unlike future lunar landings, this flight focuses on validating systems and crew performance under real spaceflight conditions.
NASA officials said the demonstration provided critical data on how Orion behaves during manual piloting near another object. These conditions are expected to be essential for future missions involving docking, assembly, or logistics operations in lunar orbit.
The crew now turns to the next phase of orbital adjustments. After completing an earlier apogee raise maneuver, mission controllers are preparing for a perigee raise burn. This engine firing will increase the lowest point of Orion’s orbit around Earth, refining its trajectory for eventual translunar injection.
The sequence of burns shapes the spacecraft’s path before it departs Earth’s gravitational influence. These adjustments are necessary to ensure precision as the mission transitions toward its planned lunar flyby.
CubeSat deployments expand international science efforts
Alongside the crewed mission, Artemis II is carrying four CubeSats, compact satellites designed for scientific research and technology demonstrations.
These payloads, housed within the Space Launch System adapter, will deploy after separation from Orion. Each satellite represents an international collaboration and targets a different aspect of space science.
Argentina’s ATENEA CubeSat will study radiation shielding and communication systems. The Saudi Space Agency’s Space Weather CubeSat-1 will measure solar radiation and magnetic fields. Germany’s TACHELES mission will test components for future lunar logistics systems. South Korea’s K-Rad Cube will analyze radiation exposure and its biological effects across the Van Allen belts.
NASA describes CubeSats as small but versatile tools that can extend mission science at relatively low cost. Their deployment during Artemis II adds a layer of experimentation beyond the primary crewed objectives.
Toilet system issue under review during mission operations
Amid the technical milestones, engineers are also tracking a minor onboard issue.
During routine spacecraft configuration checks, the crew reported a blinking fault light in Orion’s toilet system. Mission control teams at Johnson Space Center are analyzing telemetry and working with astronauts to troubleshoot the problem.
NASA has not indicated that the issue poses a risk to crew safety or mission objectives. Such anomalies are not uncommon during test flights, where systems are evaluated under operational conditions for the first time.
The crew’s schedule includes carefully timed rest periods between mission activities. After a four-hour sleep cycle, astronauts are set to wake at 7 a.m. EDT to prepare for the upcoming burn, before returning to rest later in the day.
Public reaction to the update has reflected both enthusiasm and curiosity about the mission’s technical details. “It’s fascinating to see them actually test manual flying like this,” wrote Reddit user OrbitalWatcher, in a post that drew more than 1,200 upvotes, noting that such maneuvers are rarely visible to the public.
Preparing for deeper space operations
Artemis II continues to function as a systems validation mission, bridging the gap between uncrewed tests and future lunar landings.
Each milestone, from proximity operations to orbital burns, contributes to a broader objective. NASA aims to confirm that Orion and its supporting systems can reliably carry astronauts beyond low Earth orbit and back.
The upcoming perigee raise burn represents another step in that process. Once completed, it will help finalize the spacecraft’s orbit before the mission advances toward its lunar trajectory.
For engineers and mission planners, these incremental steps are essential. They provide the data needed to support more complex operations in future Artemis missions, including sustained human presence on the Moon.
Also Read:
Artemis II Mission Launch: NASA Sends Crew on First Moon Flyby in 50 Years
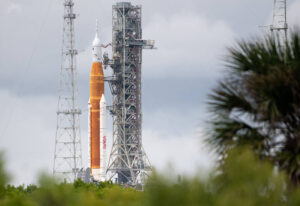
NASA’s Artemis II Rocket Reaches Launch Pad 39B, Final Countdown Begins


")