

Using MIRI (Mid Infrared Instrument) on board the James Webb Space Telescope (JWST), a team of researchers led by former MPIA (Max Planck Institute for Astronomy, Heidelberg, Germany) PhD student Sebastian Zieba (Center for Astrophysics | Harvard & Smithsonian, Cambridge, USA) and Laura Kreidberg, MPIA Director and study PI (principal investigator), analysed the surface composition of the rocky exoplanet LHS 3844 b. Beyond characterizing exoplanetary atmospheres, this kind of deciphering the geological properties of planets orbiting distant stars is the next step in unveiling their nature. The results of this investigation are now published in the journal Nature Astronomy.
A dark and airless rocky super-Earth
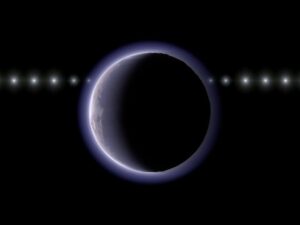
LHS 3844 b is a rocky planet 30% bigger than Earth and orbits a cool red dwarf star once within roughly 11 hours. Whirling just three stellar diameters above the host star’s surface, the planet is tidally locked to its orbit. This means one rotation takes just as long as one revolution. As a result, the same hemisphere of LHS 3844 b always faces its star, producing a constant dayside with an average temperature of about 1000 Kelvin (approximately 725 Degrees Celsius or 1340 Degrees Fahrenheit). The LHS 3844 system is only 48.5 light-years (14.9 parsecs) away from Earth.
“Thanks to the amazing sensitivity of JWST, we can detect light coming directly from the surface of this distant rocky planet. We see a dark, hot, barren rock, devoid of any atmosphere.” – Laura Kreidberg, MPIA.
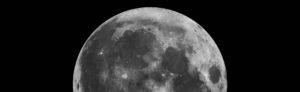
With its dark surface, LHS 3844 b may resemble a larger version of the Moon or the planet Mercury. This conclusion is based on analysing the infrared radiation received from the planet’s hot dayside. However, when measuring this radiation, we cannot see the planet directly; instead, we register the repeating change in brightness we receive from the star and the orbiting planet combined.
MIRI divided a portion of the planet’s infrared emission, ranging from 5 to 12 micrometres, into smaller wavelength sections and measured the brightness per wavelength bin. This is what astronomers call a spectrum, a rainbow-like distribution of the light’s components. Another data point, obtained from observations with the Spitzer Space Telescope and published a few years ago, augmented the analysis.
Constraining geological activity
Similar to how exoplanetary atmosphere research has benefited from climate science, this emerging field of exoplanetary geology draws on Earth-based geologic knowledge. Zieba, Kreidberg, and their collaborators ran models and accessed template libraries of rocks and minerals known from Earth, the Moon, and Mars to see what infrared signatures they would produce under the conditions on LHS 3844 b. Comparing observation-based data with these computations confidently ruled out a composition comparable to Earth’s crust, typically silicate-rich minerals such as granite.
Although this result is not very surprising – even in the Solar System, Earth is the only planet with such a crust – it may reveal details on LHS 3844 b’s geological history. Earth-like silicate-rich crusts are thought to form through a prolonged refinement process that requires tectonic activity and typically relies on water as a lubricant. The rocky material repeatedly melts and solidifies as it is mixed with mantle material, leaving the lighter minerals on the surface.
“Since LHS 3844 b lacks such a silicate crust, one may conclude that Earth-like plate tectonics does not apply to this planet, or it is ineffective,” says Sebastian Zieba. “This planet likely only contains little water.”
What can we deduce about the exoplanet’s rocky surface?
Instead, the dark surface points to a composition reminiscent of terrestrial or lunar basalt, or of Earth’s mantle material. However, the astronomers attempted an even more detailed characterization.
A statistical analysis of how well this spectrum fits various mineral mixtures and configurations revealed that extended solid areas of basalt or magmatic rock best match the observations. They are rich in magnesium and iron and can include olivine. Crushed material, such as rocks or gravel, also fits fairly well, whereas grains or powders are inconsistent with the observations due to their brighter appearance, at least at first glance.
Without a protective atmosphere, planets are subjected to space weathering, predominantly driven by hard, energetic radiation from the host star and impacts from meteorites of various sizes.
“It turns out, these processes not only slowly dissolve hard rocks into regolith, a layer of fine grains or powder as found on the Moon,” explains Zieba. “They also darken the layer by adding iron and carbon, making the regolith’s properties more consistent with the observations.”
Geologically fresh or weathered? Two possible scenarios
This assessment left the astronomers with two scenarios for the planet’s surface that match the data equally well. One involves a surface dominated by dark, solid rock composed of basaltic or magmatic minerals. Compared to geological timescales, space weathering alters its properties quickly. Therefore, the astronomers conclude that, in this scenario, the surface should be relatively fresh, produced by recent geological activity, such as widespread volcanism.
The second scenario also proposes a dark surface, comparable to the Moon or Mercury. Still, it accounts for prolonged space weathering, which leads to extended regions covered by a darkened regolith layer, a fine powder also present on the Moon, as evidenced by the iconic photos of the astronauts’ footprints. This alternative relies on longer periods of geological inactivity, thereby requiring conditions opposite to the first scenario.
Attempts to resolve the ambiguity
These two alternatives differ in the degree of recent geological activity required. On Earth and other active objects in the Solar System, a typical phenomenon during such activity is outgassing. Sulphur dioxide (SO2) is a gas commonly connected to volcanism. If present on LHS 3844 b in reasonable amounts, MIRI should have detected it. Still, it found nothing. Therefore, a recent period of activity seems unlikely, which leads the astronomers to favour the second scenario. If correct, LHS 3844 b may truly look much like Mercury indeed.
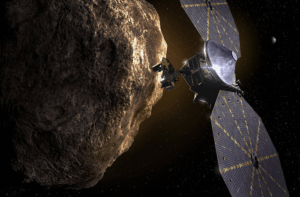
In order to test their idea, Zieba, Kreidberg, and their colleagues are already pursuing a more direct approach. They have obtained additional JWST observations, which should enable them to discern surface conditions by exploiting small differences in how solid slabs and powders emit or reflect light. The distribution of emission angles depends on surface roughness, which affects the amount of radiation received at a given viewing angle. This concept is successfully applied to characterizing asteroids in the Solar System. “We are confident the same technique will allow us to clarify the nature of LHS 3844 b’s crust and, in the future, other rocky exoplanets,” concludes Kreidberg.
Also Read:
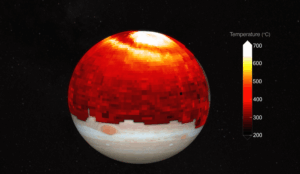
Space News: Planetary-scale ‘heat wave’ discovered in Jupiter’s atmosphere
Future Spacecraft Material Found, Resists 4,000 Degrees Celsius


