Arun has been associated with India International Times since 2018 and he has been a key reporter in covering science and space related stories. He can be reached at arunKnn@indiainternationaltimes.com.
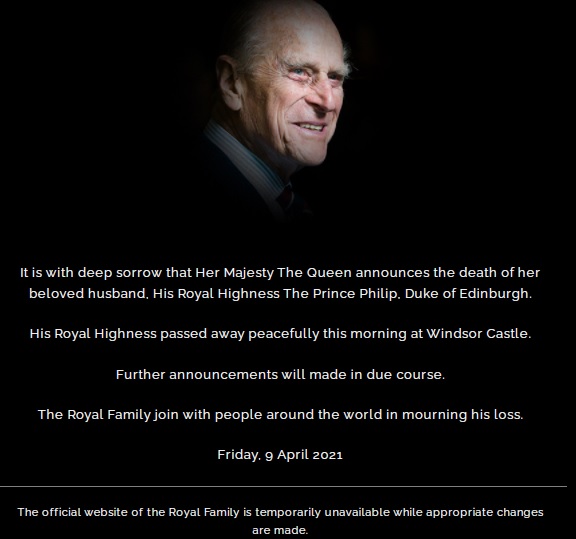
Buckingham Palace announced Friday, 9 April 2021, that Prince Philip, Duke of Edinburgh, has died.
In a statement, the British Royalty said:” It is with deep sorrow that Her Majesty The Queen announces the death of her beloved husband, His Royal Highness The Prince Philip, Duke of Edinburgh.
His Royal Highness passed away peacefully this morning at Windsor Castle. Further announcements will made in due course. The Royal Family join with people around the world in mourning his loss.”
The same message has been shared on Twitter:
It is with deep sorrow that Her Majesty The Queen has announced the death of her beloved husband, His Royal Highness The Prince Philip, Duke of Edinburgh.
The husband of Britain’s Queen Elizabeth II, Philip was in hospital for a month until March 16 and returned to Windsor Castle after being treated for an infection and undergoing a medical procedure.
He had been treated in two different hospitals — King Edward VII’s Hospital and St Bartholomew’s Hospital. On March 4, he had undergone a successful medical procedure on a heart condition.
Philip retired from public duties in 2017, and had withdrawn from the public. In fact, both he and the Queen received their coronavirus vaccinations in early January.
His last public statement was early this month when praised those involved in the fight against the pandemic. He and Queen Elizabeth II had been married for 73 years.
Like a Swiss Army knife, NASA’s Lightweight Surface Manipulation System (LSMS) technology is likely to find many ways of usage on the surface of Moon as part of its Artemis moon program.
This lightweight robotic crane with a structurally efficient truss frame and cable actuation mimics the movement of a human arm, but with a much longer reach as seen in the visual provided by NASA. It is scalable to fit any sized lander, vehicle, or surface application and can use a toolbox of quick-interchange end-effectors, or tools, that allow it to act as a hoist, forklift, regolith scoop, welder, said the US space agency.
“The unique thing about the LSMS is its dexterity and multi-functionality,” said Barmac Taleghani, project manager at NASA’s Langley Research Center in Hampton, Virginia.
The LSMS tested at Langley more than a decade ago to demonstrate the concept for offloading large payloads, such as habitats and rovers, from landers on human exploration missions. Once it is used on the moon’s surface, it’s likely to be sent to Mars too in future NASSA programs.
“We started thinking about additional tools that could be useful so that when you land the LSMS it could be used for multiple tasks,” said Tom Jones.“You’ve already carried that mass there; why not reuse it?”
Meanwhile, LSMS has been upgraded to include a suite of new tools, such as a bucket truck end-effector for digging and maneuvering regolith, a forklift tine tool for lifting cargo pallets, and a welding tool, in addition to greater autonomous functionality. The next design is on a larger for a large cargo to lunar lander under the artemis project.
Although similar in structural design to a terrestrial crane, the LSMS uses a cable-driven actuation system to articulate its arm links and precisely maneuver payloads.
Credits: NASA
“As we establish a sustainable presence on the Moon under the Artemis missions, we will need to start setting up multiple elements, and there will be a wide range of tasks that could leverage the versatility and functionality of the LSMS,” Jones said.
The new LSMS will be similar in size to the original prototype with about a 25-foot reach and will be able to lift payloads weighing around one metric ton on the Moon, equal to approximately 2,200 pounds, or the size of an elephant.
Jones further said, “LSMS is designed to operate either on the Moon or Mars or really any kind of planetary body. There may be different environmental concerns depending on the destination, but the hardware would be very similar.”
A 1,300-year-old Hindu temple of Vishnu has been discovered by Pakistani and Italian archaeological team at a mountain in northwest Pakistan’s Swat district.
The temple was unearthed during an excavation at Barikot Ghundai. Built 1,300 years ago during the Hindu Shahi period, the temple site has traces of cantonment and watchtowers, said Fazle Khaliq of Khyber Pakhtunkhwa Department of Archaeology.
The Hindu Shahis or Kabul Shahis ruled present day Afghan and Pakistan region during 850 and 1026 AD centred around the Kabul Valley, including Gandhara (modern- Pakistan and Afghanistan) and northwestern India. With a water tank near the temple site, it reflected many ancient temple structures in south India.
Excavation under way at Barikot in Swat district of Pakistan’s Khyber Pakhtunkhwa Province. Photo: Italian Archaeological Mission to Pakistan
Fazle Khaliq said that Swat district is home to many thousand-year-old archaeological sites belonging to the Hindu Shahi period. Dr. Luca M. Olivieri, who is the current Director of the Italian Archaeological Mission in Pakistan and joint mission explorer of the temple, said this was the first temple of the Ghandhara civilisation discovered in Swat district.
Swat home to Hindu, Buddhist temples
Modern archaeological excavations began in Swat in 1955 and remained uninterrupted for 60 years, except for brief interruption between 2007 and 2010 due to insurgency in the valley.
The project has taken up conservation at Jahanabad, the colossal rock-cut Buddha mined by the Taliban, the excavation at two major protohistoric graveyards, the excavations and conservations at three major Buddhist sacred areas, and finally the large-scale excavation project at the historic settlement site of Bazira/Vajiristhana (Barikot) in the region.
A ‘rogue editor network’ infiltrated a research journal’s peer-review system in an attempt to publish sub-standard papers in an attempt to subvert the scietific research standards.
The hijackers created fake e-mail accounts and web domains to impersonate respected academics, and managed to accept 19 papers for publication at The Journal of Nanoparticle Research. However, the suspicious activity was flagged by journal editors and by the research-integrity department of the publisher (Springer Nature). But the modus operandi has left the scientific community shocked.
The Journal of Nanoparticle Research said out of the 19 articles which were accepted, some of them were published online, due to the attack by ‘an organised rogue editor network’.
Modus operandi
Fraudsters generated fake email addresses that mimicked those of real universities and respected academics to approach the journal, which is published by Springer Nature. They suggested an idea for a themed issue on ‘the role of nanotechnology and internet of things in healthcare’. “They contacted us, not just with a fake email address, but also fake domains that were very similar to one university in Germany and one in the UK,” revealed Humboldt University chemist Nicola Pinna, who serves as the journal’s executive editor.
Pinna said the proposals were “sound and quite detailed” and even included suggestions for researchers working in appropriate fields, who might wish to submit papers. When the themed issue was commissioned, they were invited to handle papers and assign referees, which enabled 19 papers to be published, that would otherwise have been rejected by the journal for failing to meet standards.
When the research integrity group from Springer flagged about the standards of the special issue, the journal’s editorial team began investigating the scam, only to find that the fake email accounts had expired. “There was no way we could even try to contact them back via these domain names – they don’t exist anymore,” said Pinna.
Sophisticated network
Apologising to the scientific community, the journal said it has put in place new measures to avoid falling victim to such scams in future, and hoped that its experience may help other publishers to stop similar attempts by fraudulent attackers of the research system.
“Indeed, we editors are sadly accustomed to dealing with plagiarism, manipulated data, fake reviewers, and duplicate publications. However, our journal has been attacked in a new way by a sophisticated and organized network,” Pinna said.
The Journal of Nanoparticle Research, founded in 1999 by Mihail (Mike) Roco. In September 2019, they received 80 manuscripts for a special issue on the “Role of Nanotechnology and Internet of Things in Healthcare.” When 19 of them were already published with low standards, they started an internal investigation and found that the supposed eminent academics who proposed the special issue had nothing to do with it.
Fake email IDs
The organized group used these their names and email addresses to hack and manipulate the peer review process. In August 2019, they bought some very similar domain names (presently expired) to the ones of the supposed university addresses. The only differences were “univ” instead of “uni” in one e-mail suffix and “-ac.uk” instead of “.ac.uk” in another.
“Have we been careless? Probably, but who would have thought scientists would go to that extent, i.e., to organize a whole rogue network and propose a sound and interesting special issue in a scientific journal, just to get few articles published?” said the publishers.
A study of nearly 108,000 people has found that people who regularly drink a modest amount of alcohol are at increased risk of atrial fibrillation, or a condition where the heart beats in an abnormal rhythm.The study, published in the European Heart Journal [1], found that, compared to drinking no alcohol at all, just one alcoholic drink a day was linked to a 16% increased risk of atrial fibrillation over an average (median) follow-up time of nearly 14 years.
This means that while four teetotallers in 100 might develop atrial fibrillation over the period of the study, five per 100 might develop the condition if they consumed alcohol starting with slightly more than an alcoholic drink a week and more than 75% of them consumed up to one drink a day [2]. The researchers categorised one alcoholic drink as containing 12 g of ethanol, which is the equivalent of a small (120 ml) glass of wine, a small beer (330 ml) or 40 ml of spirits.
IMAGE: GRAPHICAL ABSTRACT, CREDIT: EUROPEAN HEART JOURNAL
It is well known that people who drink a lot of alcohol regularly are at increased risk of developing heart failure, and heart failure can increase the incidence of atrial fibrillation. Several studies have shown a slightly higher risk of heart problems for people who never drink alcohol; they often show that this risk reduces for people who drink a modest amount, and then rises sharply the more alcohol is consumed, creating a ‘J’ shape on graphs. Until now, it has not been clear whether this was also the case for atrial fibrillation.
However, in the current study led by Professor Renate Schnabel, a consultant cardiologist at the University Heart and Vascular Center, Hamburg-Eppendorf (Germany), researchers found that although low doses of alcohol were associated with a reduced risk of heart failure compared to teetotallers, a similar ‘J’ shape reduction in risk was not seen for atrial fibrillation. This suggests that the increased risk of atrial fibrillation among people drinking small amounts of alcohol was not triggered by heart failure.
Heart failure
The researchers analysed information on 107,845 people taking part in five community-based studies in Sweden, Norway, Finland, Denmark and Italy. The participants underwent medical examinations at the time they joined the studies between 1982 and 2010 and provided information on their medical histories, lifestyles, employment and education levels. A total of 100,092 participants did not have atrial fibrillation when they enrolled and their median age was nearly 48 years (range 24-97 years).
During the median follow-up period of nearly 14 years, 5,854 people developed atrial fibrillation. The associations between alcohol consumption and the risk of atrial fibrillation were similar for all types of alcoholic drinks and for men and women.
In addition to the 16% increased risk of atrial fibrillation compared to teetotallers seen in people who consumed only one alcoholic drink a day, the researchers found that the risk increased with increasing alcohol intake; up to two drinks a day was associated with a 28% increased risk and this went up to 47% for those who consumed more than four.
The exact mechanisms by which modest amounts of alcohol could trigger atrial fibrillation are not known. Studies have shown that heavy drinking over a short period of time can trigger ‘holiday heart syndrome’ in some people, and in some atrial fibrillation patients, small amounts of alcohol can trigger arrhythmia episodes.
The mystery of how the Galápagos Islands, a rocky, volcanic outcrop, with only modest rainfall and vegetation, is able to sustain its unique wildlife habitats has been resolved.
The Galápagos archipelago, rising from the eastern equatorial Pacific Ocean some 900 km off the South American mainland, is an iconic and globally significant biological hotspot. The islands are renowned for their unique wealth of endemic species, which inspired Charles Darwin’s theory of evolution and today underpins one of the largest UNESCO World Heritage Sites and Marine Reserves on Earth.
In this new research, published in NatureScientific Reports, scientists from the University of Southampton, National Oceanography Centre and Universidad San Francisco de Quito in Ecuador used a realistic, high-resolution computer model to study the regional ocean circulation around the Galápagos Islands.
A Galápagos Toroise CREDIT Alexander Forryan
This model showed that the intensity of upwelling around the Galápagos is driven by local northward winds, which generate vigorous turbulence at upper-ocean fronts to the west of the islands. These fronts are areas of sharp lateral contrasts in ocean temperature, similar in character to atmospheric fronts in weather maps, but much smaller. The turbulence drives upwelling of deep waters toward the ocean surface, thus providing the nutrients needed to sustain the Galápagos ecosystem.
Alex Forryan of the University of Southampton, who performed the research, said: “Our findings show that Galápagos upwelling is controlled by highly localised atmosphere-ocean interactions. There now needs to be a focus on these processes when monitoring how the islands’ ecosystem is changing, and in mitigating the ecosystem’s vulnerability to 21st -century climate change.”
Professor Alberto Naveira Garabato, also of the University of Southampton, who led the project supporting the research, said the new knowledge of where and how the injection of deep-ocean nutrients to the Galapagos ecosystem happens is helpful in expanding the Galápagos Marine Reserve.
The Study on Stress, Spirituality and Health (SSSH), a cutting-edge proteomics analysis, suggests that religious beliefs modulate protein expression associated with cardiovascular disease in South Asians in the United States.
The research, published by investigators from Massachusetts General Hospital (MGH) and Beth Israel Deaconess Medical Center (BIDMC) and the University of California San Francisco (UCSF) in Scientific Reports, demonstrates that spiritual struggles, in particular, significantly modify the impact of unique proteins on risk of developing cardiovascular disease (CVD) in U.S. South Asians, a community that has especially high rates of CVD.
This study represents the first proteomics analysis ever conducted on protein levels in relationship to CVD within a U.S. South Asian population and the first published study to analyze proteomics signatures in relationship to religion and spirituality in any population.
“Before we can develop the best interventions to reduce CVD disparities, we need to understand the biological pathways through which health disparities are produced,” says the study’s principal investigator and co-senior author Alexandra Shields, director of the Harvard/MGH Center on Genomics, Vulnerable Populations and Health Disparities at the MGH Mongan Institute and associate professor of Medicine at Harvard Medical School (HMS).
“As this study shows, psychosocial factors – and religious or spiritual struggles in particular – can affect biological processes that lead to CVD in this high-risk population. Spirituality can also serve as a resource for resilience and have a protective effect. Given that many of the minority communities that experience higher levels of CVD also report higher levels of religiosity and spirituality, studies such as the SSSH may help identify new leverage points, such as spiritually focused psychotherapy for those in spiritual distress, that could reduce risk of CVD for such individuals.”
Results of the study, which included 50 participants who developed CVD and 50 sex- and age-matched controls without CVD from the Mediators of Atherosclerosis in South Asians Living in America (MASALA) Study (100 participants), indicate that there may be unique protein expression profiles associated with CVD in U.S. South Asian populations, and that these associations may also be impacted by religious struggles, in which, for example, individuals experiencing adverse life events feel they are being punished or abandoned by their God, or have a crisis of faith.
The MASALA study includes 1,164 South Asians who were recruited from the San Francisco Bay Area and the greater Chicago area and followed for approximately eight years with the goal of investigating factors that lead to heart disease among this high-risk ethnic group. MASALA is one of the original cohorts participating in SSSH, through which this research was conducted.
“Understanding the pathways of this mechanism at the molecular level using proteomics technology is crucial to developing potential interventions that can help reduce CVD incidence in this population,” says Long H. Ngo, PhD, lead author and co-director of Biostatistics in the Division of General Medicine at BIDMC and associate professor of Medicine at HMS.
Co-senior author Towia Libermann, PhD, director of Genomics, Proteomics, Bioinformatics and Systems Biology Center at BIDMC, adds: “The kinds of blood-based protein biomarkers used in this study are particularly effective in assessing CVD risk because they carry clinical information about risk of disease and are the most commonly used molecules for diagnostic applications.”
The Union Cabinet of India has approved the signing of a Memorandum of Cooperation between the Government of India and Government of Japan, on a Basic Framework for Partnership for Proper Operation of the System Pertaining to “Specified Skilled Worker”. Here are the details:
Details:
The present Memorandum of Cooperation would set an institutional mechanism for partnership and cooperation between India and Japan on sending and accepting skilled Indian workers, who have qualified the required skill and Japanese language test, to work in fourteen specified sectors in Japan. These Indian workers would be granted a new status of residence of “Specified Skilled Worker” by the Government of Japan.
Implementation Strategy:
Under this MOC, a Joint Working Group will be set up to follow up the implementation of this MOC.
Major Impact:
The Memorandum of Cooperation (MOC) would enhance people-to -people contacts, foster mobility of workers and skilled professionals from India to Japan.
Beneficiaries:
Skilled Indian workers from 14 sectors viz. Nursing care; Building cleaning; Material Processing industry; Industrial machinery manufacturing industry; Electric and electronic information related industry; Construction; Shipbuilding and ship-related industry; Automobile maintenance; Aviation; Lodging; Agriculture; Fisheries; Food and beverages manufacturing industry and Food service industry would have enhanced job opportunities to work in Japan.
The much-awaited 51st edition of the International Film Festival of India (IFFI) got off with enthralling cultural performances amidst a dazzling ceremony celebrating the joy of cinema. Shyama Prasad Mukherjee Indoor Stadium at Panaji in Goa on Saturday reverberated with the passion of film-stars, film-makers and film-lovers from around the world.
The Opening Ceremony of Asia’s oldest and India’s biggest film festival has been hosted by actor, author and film-producer Tisca Chopra and became further illuminated by the dazzling presence of eminent film-maker Priyadarshan Nair and noted actor Sudeep who has been the Chief Guest, among other celebrated film personalities. The function also saw the graceful presence of Union Minister for Information and Broadcasting, Prakash Javadekar and Chief Minister of Goa, Pramod Sawant, among other dignitaries.
Speaking on the occasion, Sudeep, also known as Kichha Sudeep said, “Let Cinema be the new pandemic”. He said, “Cinema is one fraternity that, from one seat, takes you all around the world, gets you the knowledge, gets you closer to the culture of every fraternity across the world”.
Addressing the audience, Union Minister for Information and Broadcasting, Prakash Javadekar said that 600 International entries and 190 Indian entries have been received this year, reflecting the huge importance the world attaches to it, said the Minister.
Javadekar announced, on the occasion of 100th birth anniversary of Sheikh Mujibur Rahman, the two countries are together making a film titled Bangabandhu.
Veteran Actor and Director Biswajit Chatterjee has been conferred Indian Personality of the Year Award, he further announced. Jadavekar said, unlike other countries, India has multiple favourable destinations for shooting. Hence, we need to promote ‘Shoot in India’, stated the Minister.
The High Commissioner of Bangladesh to India, Mohammad Imran was also present on the occasion. Bangladesh is the focus country of the festival this year. Apart from the recognition of the creativity and ingenuity of the film-makers of Bangladesh, it is also a testimony of the depth of relations and a historic bind between the two neighbouring countries, said the High Commissioner. The delegates will be treated to ten of the best films from the focus country Bangladesh, showcasing the country’s cinematic excellence and contributions to the world of cinema.
The Lifetime Achievement in the 51st IFFI has been given to Italian cinematographer Mr. Vittorio Storaro. In a video message, Mr Storaro thanked IFFI for recognizing his journey. The legendary cinematographer said that he owes the incredible visual journey he had, to his colleagues and great directors like Bernardo Bertolucci, Francis Coppola, Carlos Oliveira and Woody Allen. “They led me in a special way, like in an orchestra, to use my language of light”, he said. In a word of advice to young cinematographers, he said, “Study, research, prepare yourself. Love what you do, only if you love and believe in something, you can make it”.
The 14th Edition of NFDC Film Bazaar was also virtually launched by Union Minister Javadekar on the occasion. This NFDC Film Bazaar will be held in a hybrid format which will be both offline and online. The Film Bazaar will be held virtually but it will include all sections usually held in previous editions. Film Bazaar is the largest South Asian film market. It encourages creative and financial collaboration between the South Asian and International film communities.
A trailor of the festival’s opening film ‘Another Round’ by Danish film-maker Thomas Vinterberg was played in the opening ceremony. “As a starting point, this was a pure celebration of alcohol, but it grew into a celebration of life”, said the Director in a video message. The movie is Denmark’s official entry to the Oscars and stars Cannes Best Actor Award winner Mads Mikkelsen.
In the 51st IFFI, 126 films from 60 countries will be showcased in International sections. 85 films out of these will be premiere screenings, including 7 World Premieres, 6 International Premieres, 22 Asian Premieres and 50 Indian Premieres.
Masterclasses and In-conversation sessions, which have been the highlight of IFFI over the years, will also be held virtually. Renowned film personalities like like Shekhar Kapur, Priyadarshan, Pablo Cesar (from Argentina) and Prasanna Vithanage (from Sri Lanka) will be sharing their valuable experience for these sessions.
Restrospective Section
A retrospective section will showcase legendary film-maker Satyajit Ray’s popular classics like Pather Panchali, Shatranj Ke Khilari, Charulata, Ghare Baire and Sonar Kella. On the occasion of the 150th Birth Anniversary of the father of Indian Cinema, four films by Dadasaheb Phalke will be screened.
IFFI will also pay Homage to 18 film personalities who passed away in the previous year. This includes much loved personalities like Irrfan Khan, Rishi Kapoor, S.P Balasubrahmanyam, Soumitra Chatterjee, Sushant Singh Rajput and Basu Chatterjee.
World premiere of ‘Mehrunisa’ by Sandeep Kumar will take place mid-fest in IFFI. Japanese movie ‘Wife of a Spy’ directed by Kiyoshi Kurosawa will bring the curtains down on this edition of the festival.
Whereas film connoisseurs can enjoy films by prominent filmmakers such as Pedro Almodóvar Caballero, Ruben Ostlund and Kim Ki-duk, delegates will also have the opportunity to enjoy seven great new films nominated for the Best Debut Feature Film of a Director. Apart from this, ten films will be shown as part of the ICFT- UNESCO Gandhi Medal competition, selected for reflecting Mahatma Gandhi’s ideals of peace, tolerance and non-violence.
Due to the current Covid scenario, many Bollywood celebrities could not attend the function. Their video messages brought a feel of their virtual presence in the ceremony.
“What an amazing way to kick-start 2021 by celebrating some of the finest cinematic works from across the globe” – Ayushmann Khurrana
“IFFI is something we all film-enthusiasts look forward to. One of the most prestigious festivals in the world” – Anil Kapoor
What better way to kick-start 2021 than by celebrating some of the finest cinematic works from across the globe” – Madhuri Dixit
“Congratulations IFFI on bringing in your 51st edition” – Ranveer Singh
“Go and watch some great films” – Siddhant Chaturvedi
“…..I am so glad that despite the pandemic and the trials the year has put us through, IFFI has been held with all safety precautions put in place” – Vidya Balan
“It has become abundantly clear that the internet is changing the way in which people experience watching movies. I am sure the Goa film festival will explore reinvent or reframe the film festival experience itself. I see such online festivals becoming popular as being a way of building up a community. This, perhaps, will be the new norm of interacting with film festivals, especially with the film-makers, actors and technicians from around the globe. ” – Mohan Lal
The cultural performances in the opening ceremony specially focused on the local folk culture and music of Goa – a place that has been home to IFFI since 2004.
As of Saturday, 16 January, 2021, cases of Avian Influenza have been confirmed in poultry in Latur, Parbhani, Nanded, Pune, Solapur, Yavatmal, Ahmednagar, Beed and Raigad districts of Maharashtra and the neighbouring state of Madhya Pradesh.
The Avian Influenza has been confirmed in Chhatarpur district of Madhya Pradesh (crow); Surat, Navsari and Narmada districts of Gujarat (crow); Dehradun district of Uttarakhand (crow); Kanpur district of Uttar Pradesh (crow). Additionally, in Delhi, Pigeon and brown fish owl in Najafgarh and Heron in Rohini have tested positive for avian influenza.
As per the report, received from Central Poultry Development Organisation Mumbai, Govt of India unusual mortality of poultry have been found in the farm. The samples have been sent to the designated laboratory for testing.
In the State of Chhattisgarh RRTs has been deployed and culling of poultry is underway in epicentre of Balod district. Further, in Madhya Pradesh also RRTs have been deployed. Culling operation of poultry is underway in the epicentre of Harda district of Madhya Pradesh.
The central teams formed for monitoring the situation in the affected areas of the country are visiting the affected sites and conducting epistemological studies.
States have been requested to rethink their decisions to impose ban on sale of poultry and poultry products and allow selling of poultry and poultry products sourced from the non-infected areas/states. It is reiterated that consumption of well cooked chicken and eggs is safe for humans.
Consumers are advised not heed to baseless rumours that are unscientific and often lead to confusion. These adversely affect poultry and egg markets and thereby poultry and maize farmers, who are already affected by the COVID 19 pandemic lockdown.
Following the advisories of the department, states are undertaking awareness generation activities through newspaper advertisements, social media platforms etc. Also, continues efforts to generate awareness about Avian Influenza and how to deal with the situation is being shared among the general public through various media platforms including social media platforms like Twitter and Face book handles.
Hours after Britain approved the Oxford University-AstraZeneca COVID-19 vaccine, India’s expert panel met on Wednesday to review the data before submitting its final recommendation for approval. The entire process is likely to take a week and the announcement is likely to be known next week.
The Subject Expert Committee of the Central Drug Standard Control Organization (CDSCO) apparently pondered the data presented before it on Wednesday. The vaccine Covishield by SSI (Oxford-AstraZeneca) is a non- replicating viral vector vaccine with viruses that have been modified to act as delivery systems carrying the viral antigens to the body’s immune cells. Chimpanzee adenovirus is the vector used to deliver in this vaccine.
Once the application of Serum Institute of India for the same vaccine manufactured in India for emergency use authorization is approved, rollout will begin in a week’s period making India the second country to give EUA to the vaccine. Along with SII, Hyderabad-based Bharat Biotech had also applied for Emergency Use Authorization for its Covaxin and made its presentation on Wednesday before the experts panel.
Amid fears of new strain spreading rapidly, the UK became the first country in the world to approve the vaccine called Covishield, following a recommendation from the Medicines and Healthcare products Regulatory Agency (MHRA). Withthis, the rollout of mass vaccination is expected to begin in the first week of January in both the countries.
Vaccine-fda
Soon after the UK approval, AstraZeneca said in a statement that first doses of the vaccine will be released to begin the vaccinations drive and that the company hopes to supply millions of doses in the first quarter of 2021 as part of its deal with the UK government to supply up to 100 million doses in total. In India, SII is ready with 50 million doses of the vaccine already.
Today marks an important milestone in the fight against #COVID19. Interim data show the #OxfordVaccine is 70.4% effective, & tests on two dose regimens show that it could be 90%, moving us one step closer to supplying it at low cost around the world>> https://t.co/fnHnKSqftTpic.twitter.com/2KYXPxFNz1
Earlier this month, the CDSCO had asked SII to submit the outcome of the assessment of UK-MHRA before granting emergency use authorization, updated safety data of the Phase II/III clinical trials and immunogenicity data from the clinical trial in UK and India.
Vaccination Drive
The central government plans to vaccinate nearly 30 crore people in the first phase, covering about one crore healthcare workers, about 2 crore frontline and essential staff besides 7 crore elderly, mostly above the age of 50 years with comorbidities.
SII CEO Adar Poonawalla on Monday said 40-50 million doses of COVID-19 vaccine have already been stockpiled, the rollout will be the New Year gift to the country that had witnessed severe health and financial crisis throughout the year 2020. Together with Bharat Biotech, the two firms can produce 65 million doses of the vaccine per month.
Erstwhile waste rock from abandoned and closed mines in the eastern Adirondack Mountains, New York, may prove valuable source for rare earth elements, said a newly published research after USGS found it following two of its recent surveys.
Rare earth elements are critical for advanced technologies such as cell phones, supermagnets, computers, medical apparatus, renewable energies and advanced defense systems, which are mostly produced in China.
The results from airborne and ground surveys conducted by the U.S. Geological Survey and collaborators. “The possibility of accessing rare earth elements from mine waste and mill tailings is attractive partly because the minerals have already been excavated from the ground,” said USGS scientist Ryan Taylor, who led analyses of rock samples here.
USGS scientists were able to detect both mineral deposits and larger mill tailings piles from airplane surveys of old iron mines in December 2015 and analyzed samples that showed rare earth minerals from the deposits, waste and mill tailings.
Mill tailings from mining activity at the Cheever Mine, Essex County, New York / Credit: Anji Shah, USGS
In the 1800s and 1900s, the eastern Adirondack Mountains in upstate New York were heavily mined for iron, which played a key role in industrialization of the Northeast prior to and during World War II. The mining activities left behind piles of waste rock and mill tailings (the residuals of ore processing) throughout the region.
“This inspired the USGS, New York state, and local groups to work together to analyze waste rock and tailings,” said USGS Director Dr. Jim Reilly. “We look forward to future collaborations with them and potentially other states in this emerging area of study.”
What are rare earth minerals?
The rare earth elements are mostly contained in millimeter-size crystals known as fluorapatite in deposits of iron ore. When the iron was mined, the fluorapatite was usually left behind as waste since it was considered an unwanted impurity. But over a period, these waste products gained value and the fluorapatite has elevated levels of heavy rare earth elements such as gadolinium, which is used in medical imaging; terbium, which is used in cell phones; and yttrium, which is used in lasers.
USGS scientist Ryan Taylor collects samples from tailings piles at the Cheever Mine in Essex County, New York / Credit: Anji Shah, USGS
The amount of total rare earth elements varies from deposit to deposit, but each deposit is enriched in the heavy rare earth elements. Total rare earth elements range from zero to nearly 2.2% for the waste and tailings piles and zero to nearly 4.8% for ore. It may be seemingly low, but these concentrations indicate significant potential, with the higher grades even comparable to other heavy rare earth element deposits, such as the clay deposits in South China, which are one of the primary sources for China’s rare earth elements and the primary source of the world’s heavy rare earth elements.
“There may be some challenges to processing the tailings for rare earth elements,” said USGS scientist and project chief Anji Shah. “While the fluorapatite contains recoverable rare earth elements, it also contains thorium, a weakly radioactive element which has economic uses but also requires careful handling.”
That thorium, however, makes mill tailings easier to locate by airplane surveys since natural, low-level radioactivity can be seen on the images, Shah explained. When these airplane surveys were conducted for detecting the iron ore bodies based on subtle variations in Earth’s magnetic field from the sky, the researchers created 3D models showing the size and shape of the deposits beneath Earth’s surface.
Three-dimensional model of the iron ore deposits in eastern Adirondack Mountains, New York. Pink areas show high magnetic susceptibility, representing ore bodies. Small gray spheres represent known mines.
In addition to mine tailings in the Adirondacks, the USGS is looking into rare earth element occurrences elsewhere in the US, such as in clays in the Southeast or phosphate rocks throughout the U.S. Efforts to map rare earth-bearing formations are also ongoing at the rare earth mine in Mountain Pass, California too.
The continents of Asia, Australia and Americas surrounding the Pacific Ocean have experience 61 earthquakes ranging from 2.5 to 6.3 on Christmas Day, Dec. 25, 2020, indicating that the quake-prone zones are active again. The USGS has recorded more than ten on its quake map today to reiterate the tectonic disturbances beneath the surface, more prominently in the Philippines and in the southern Americas.
An earthquake measuring 6.3 on the Richter scale on Friday morning at 7:43 local time jolted the Philippines’ Batangas province located on the main island of Luzon, according to the Philippine Institute of Seismology and Volcanology (Phivolcs). Some 100-km south of Manila, the earthquake hit the region at a depth of 102 km, affecting nearby provinces of Batangas, Laguna, Cavite, Rizal.
However, the quake will not cause damage as it was tectonic in origin, though it may trigger aftershocks, said Phivolcs Director Renato Solidum. The possibility of tsunami was ruled out. So far, no reports of damage have been reported, said a spokesman for the National Disaster Risk Reduction and Management Council (NDRRMC).
Why so many earthquakes now?
As noticed, there are many earthquakes with an intensity of 40 and above to 7 or above being detected throughout the year. According to USGS, a temporary increase or decrease in seismicity is normal fluctuation of earthquake rates and rules out any increase or decrease worldwide is an indication that a large earthquake is imminent.
The ComCat earthquake catalogue has recorded an increasing number of earthquakes in recent years not because there are more earthquakes, but because there are more seismic instruments which are able to record even minor tectonic movements and of course, earthquakes.
The National Earthquake Information Center of the US usually records around 20,000 earthquakes around the globe per year, or approximately 55 per day. When it goes beyond this average number to more than 70, it may trigger intensified analysis by these seismic centres. Moreover, the instant communication via Internet has also increased the interest in natural disasters as the public are aware of earthquakes more quickly than ever before.
Record in 50 years
According to the seismic records since 1900, about 15 major earthquakes in any given year are expected with a magnitude of 7 range on Richter scale and one megaquake measuring more than a magnitude of 8.0 or greater. In the past 50 years, USGS records show that the earth has exceeded the long-term average number of major earthquakes about a dozen times.
The year with the largest total was 2010, with 24 major earthquakes of 7M and in other years, the total was below the annual long-term average of 16 major earthquakes. The year 1989 had witnessed 6 major earthquakes and 1988 only experienced 7 major earthquakes.
Nearly a year into the pandemic when China reported the first cases of Covid-19 in Wuhan, the United Kingdom has reported a mutated strain of the coronavirus which is up to “70% more infectious and transmissible,” sending the world again into a panic mode despite vaccines on roll out already.
The Covid-19 pandemic has already affected 76.8 million and killed 1.7 million world over. So, how would the new strain of Coronavirus that has attracted isolation of the United Kingdom this time, affect us.
What’s this new strain?
The UK variant of the coronavirus has about 20 mutations, with higher potential to impact how human cells. Dr. Muge Cevik—an infectious disease expert at the University of St. Andrews in Scotland and a scientific advisor to the British government told The New York Times that these mutations might make the virus more contagious and no longer stable as believed previously.
Given the rise in infections concerning the new variant in London and surrounding areas, thousands scrambled to leave London as European countries quickly reacted closing their borders for travelers from the UK. Prime Minister Boris Johnson has come out with stringent lockdown since March and declared, “When the virus changes its method of attack, we must change our method of defense.”
Vaccine-fda
UK officials say the virus has become 70% more infectious and transmissible due to the laxity among people one year into the pandemic. However, these perceptions are based on models and lab simulations but Dr. Cevik attributed it to human behaviour to relax precautions that might have triggered the rapid mutation. “Overall, I think we need to have a little bit more experimental data,” Dr. Cevik said.
While the scientific community is observing the virus mutation, experts say, it could take years before the virus can evolve enough to leave the current vaccines powerless. Jesse Bloom, an evolutionary biologist at Seattle’s Fred Hutchinson Cancer Research Center, told NYT. that even in case of influenza that evolves quickly, it took nearly five to seven years to mutate enough to evade the immune system.
Covid-19 not on-off switch
“No one should worry that there is going to be a single catastrophic mutation that suddenly renders all immunity and antibodies useless… It is going to be a process that occurs over the time scale of multiple years and requires the accumulation of multiple viral mutations,” he said and added, “It’s not going to be like an on-off switch,” said Bloom.
The Pfizer-BioNTech and Moderna vaccines notably induce an immune response to the spike protein present on the coronavirus surface but each infected person produces a large, complex collection of antibodies to this protein. “No matter how the virus twists and weaves, it’s not that easy to find a genetic solution that can really combat all these different antibody specificities, not to mention the other arms of the immune response,” says Kartik Chandran, a virologist at the Albert Einstein College of Medicine in New York.
A UCLA-led study explains how COVID-19 increases the risk for stroke. Scientists made the finding by running fluid spiked with a COVID-19-like protein through a 3D-printed model of the arteries of a patient who had suffered a stroke.
Although COVID-19 was first identified by its severe respiratory symptoms, the virus has caused strokes in young people who had no known risk factors. But little is known about how the virus increases the risk for stroke.
UCLA researchers used a 3D-printed silicone model of blood vessels in the brain to mimic the forces generated by blood pushing through an artery that is abnormally narrowed, a condition called intracranial atherosclerosis. They showed that as those forces act on the cells lining the artery, and increase the production of a molecule called angiotensin-converting enzyme 2, or ACE2, which the coronavirus uses to enter cells on the surface of blood vessels.
Creating new model
“The flow directly influences ACE2 expression,” said Dr. Jason Hinman, an assistant professor of neurology at the David Geffen School of Medicine at UCLA and the study’s senior author. In addition to Hinman, the study’s authors are neurologists at the Geffen School of Medicine and scientists from UC San Francisco and the Veterans Health Administration. The paper was published (PDF) in Stroke.
UCLA researchers created the model using data from CT scans of blood vessels in a human brain. After creating the new model, researchers confirmed the particles did indeed interact with the cells lining the blood vessel, mostly in the regions of the brain with higher levels of ACE2.
“This finding could explain the increased incidence of strokes seen in COVID-19 infections,” Hinman said.
Another discovery offered an insight that eventually could help identify people with COVID-19 who may have a higher risk for stroke. When the scientists analyzed which genes were turned on in the endothelial cells after the coronavirus spike proteins bound to them, they found that the genes that were activated were a specific set of immune-response genes that are found in brain blood vessel cells, but not in endothelial cells from other organs of the body.
“There’s a unique brain endothelial response to the virus that may be helpful in identifying patients who are have a higher risk for stroke,” Hinman said. The researchers intend to conduct follow-up studies using a live coronavirus in the 3D-printed blood vessel model, which would further confirm the results of the current study and clarify which COVID-19 patients may have a higher risk for stroke.
Sony has removed Cyberpunk 2077 from its PlayStation Store following complaints of glitches in the video game created by Poland’s CD Projekt.
The game that claims to be an “open-world, action-adventure story set in a megalopolis obsessed with power, glamour and body modification” and it features Hollywood star Keanu Reeves. Sony’s knee-jerk move has hit the CD Projekt, Poland’s top video game maker, with its shares tumbling down from last week’s high by 12.2% on Friday.
Sony, however, said the suspension was temporary without giving any reason. The game Cyberpunk lets gamers play as mercenary outlaw “V” when people were stuck at home during the pandemic. Since the coronavirus crisis is around, the demand for the game has boosted.
Aware of bugs
CD Projekt CEO Adam Kicinski admitted the existence of bugs as there had been fewer external testers, who could not test it from home due to COVID-19. CD Projekt has promised to work on bugs and release patches in January and February. It means the game is not ready to debut in December and the decision to launch without proper tests for bugs was a big mistake, said market analysts.
“The game needed another six months of development to fix bugs and polish it,” John Vilnis, a gamer from Brisbane, Australia said.
CD Projekt, which gained prominence with its ‘The Witcher’ series to become one of Poland’s biggest listed companies, was expected to break sales records with Cyberpunk. So far, there is no move from Google’s Stadia and Microsoft about the removal of the game from their consoles or platforms.
The launch of Cyberpunk amid the pandemic, when other big players Microsoft’s ‘Halo Infinite’ have delayed their launch is significant. Microsoft is considering full refunds to those who bought the game from the Microsoft Store.
Hospitalized COVID-19 patients have a greater risk of death if they are men or if they are obese or have complications from diabetes or hypertension, confirmed a new study conducted by University of Maryland School of Medicine (UMSOM) researchers after evaluating nearly 67,000 hospitalized COVID-19 patients in 613 hospitals across the US.
In a study published in the journal Clinical Infectious Diseases, the researchers found that men had a 30 percent higher risk of dying compared to women of the same age and health status. Hospitalized patients who were obese, had hypertension or poorly managed diabetes had a higher risk of dying compared to those who did not have these conditions. Those aged 20 to 39 with these conditions had the biggest difference in their risk of dying compared to their healthier peers.
“Predicting which hospitalized COVID-19 patients have the highest risk of dying has taken on urgent importance as cases and hospitalizations in the U.S. continue to surge to record high numbers during the month of December,” said study corresponding author Anthony D. Harris. Professor of Epidemiology and Public Health at UMSOM.
Remdesvir
For example, higher-risk patients may be given the drug remdesivir earlier in their hospitalization to help prevent severe complications or may be considered for closer monitoring or ICU admission. Healthcare providers may also want to consider these risks when determining which COVID-19 patients could benefit the most from the new monoclonal antibody therapies that, if given in the first few days of the infection, can reduce the risk of hospitalization.
Age remained the strongest predictor of mortality from COVID-19. Overall, nearly 19 percent of hospitalized COVID-19 patients died from their infection with the lowest mortality among pediatric patients, which was less than 2 percent. Mortality rates increased with each decade of life with the highest mortality, 34 percent, among those aged 80 and older.
“Older patients still have the highest risk of dying, but younger patients with obesity or hypertension have the highest risk of dying relative to other patients their age without these conditions,” said study lead author Katherine E. Goodman, a postdoctoral fellow in the Department of Epidemiology and Public Health at UMSOM.
Starting from the New Year’s Day Jan. 1, 2021, WhatsApp is updating its operating system and you cannot use it unless go for update on your smartphone now. Older smartphones which cannot receive WhatsApp updates may render you out of the social media outlet as Facebook, owner of WhatsApp, is discontinuing support for older smartphones from Jan. 1, 2021.
The smartphones running on iOS 9 and Android 4.0.3 operating systems and older versions cannot get support by WhatsApp OS updates and need to be removed, said the social media platform in a statement. It means, iPhone 4s, iPhone 5s, iPhone 5c, iPhone 6, iPhone 6s have outdated software and require to be updated immediately to run WhatsApp.
Some smartphones running on Android 4.0.3 such as HTC Desire, LG Optimus Black, Motorola Droid Razr, Samsung Galaxy S2 cannot work for WhatsApp now.
How to update WhatsApp
You can easily update WhatsApp from your phone’s application store, if you’ve received a message that isn’t supported by your version of WhatsApp. The latest version of WhatsApp contains the newest features and bug fixes, said the company.
Android
Go to the Google Play Store and search for WhatsApp. Tap Update next to WhatsApp Messenger.
iPhone
Go to the App Store and search for WhatsApp. Tap UPDATE next to WhatsApp Messenger.
KaiOS
Press JioStore or Store on the apps menu. Scroll to the side to select Social, then select WhatsApp. Press OK or SELECT > UPDATE.
How to identify the OS on your phone?
If you do not know which operating system your smartphone is working on, then go to the settings of the phone. After this, tap on General and then Information option, where you can find the software of iphone.
For Android users, they have to go to the settings of the phone, where the About Phone option will be seen. Click on it to see the software of the phone.
With images of long queues soon after allowing sale of alcohol drinks atill vivid, harmful drinking among adults increases more as they spend at home in lockdown, according to a study published in a peer-reviewed journal.
The research, based on a survey of nearly 2,000 persons aged above 18 years in the US, is the first to highlight the relationship nationally between hazardous drinking and life stresses triggered by the COVID-19 pandemic and the associated ‘lockdowns’.
The findings show the odds of heavy alcohol consumption among binge drinkers – those who, within two hours, consumed five or more drinks for men and four and above for women – rose an extra 19% for every week of lockdown.
The odds of increased alcohol intake overall for binge drinkers was more than double that of people who did not drink excessively (60% vs 28%), especially those with depression or a history of the disease. Carried out by experts at the University of Texas Health Science Center School of Public Health, in Dallas, the study also highlights that:
During the pandemic, binge drinkers on average drank four drinks per occasion, compared to two drinks among non-binge drinkers.
Participants who drank at harmful levels during the pandemic would consume seven drinks maximum on one occasion. This is compared to a maximum of two per session during the pandemic for those who did not.
Living with children in lockdown minimally reduced the odds (by 26%) of turning to the bottle for people in general.
The researchers are now calling for new intervention and prevention strategies for people in isolation at risk of hazardous drinking. Otherwise, they say there could be long-lasting health consequences. “Increased time spent at home is a life stressor that impacts drinking and the Covid-19 pandemic may have exacerbated this stress,” says Sitara Weerakoon, a PhD candidate from the University of Texas.
“Future research should consider the potential for depressive symptoms acting as a moderator (a factor that changes the impact) in the relation between the time spent under a shelter-in-place mandate (lockdown) and binge drinking. “Additional research is (also) needed to develop best treatment for people with substance use disorders who may be more susceptible to adverse health outcomes.”
The study aim was to identify a link between COVID-19-related stress factors and changes in alcohol consumption and binge drinking since the pandemic began.
The data was from an online survey completed by 1,982 adults from mid-March to mid-April, which coincided with the first US state-wide stay-at-home order on March 19. The average age of participants was 42 and the majority were white (89%) and female (69%).
Based on survey responses, the researchers categorised participants as binge drinkers, non-binge drinkers and non-drinkers. Among the factors analysed were length of time spent in lockdown, how many adults or children they were living with, current or previous episodes of depression, and job status related to lockdown such as decreased pay.
On average, every respondent had been in lockdown for four weeks, and spent 21 hours a day at home, with the majority (72%) not leaving for work.
Overall, nearly a third (32%) of participants reported binge drinking during the pandemic with binge drinkers increasing their intake. However, non-binge drinkers consumed about the same amount of alcohol than before lockdown.
Limitations of the study include the survey data being self-reported, and the fact the question on binge-drinking did not specify a time within which the alcohol was consumed.
In addition, the majority (70%) of participants were relatively high earners, a factor already associated with hazardous alcohol use. The authors say future research is needed in a more ‘generalizable population’.
President of The Walt Disney Company for Asia Pacific and the Chairman of Star and Disney India Uday Shankar is elected the President, FICCI for the year 2020-21 and he will be succeeding Dr Sangita Reddy, President, FICCI, and Joint Managing Director, Apollo Hospitals Group.
A FICCI statement said the election took place during FICCI’s 93rd AGM on 11,12 & 14 December 2020. Mr Shankar is currently the President of The Walt Disney Company for Asia Pacific and the Chairman of Star and Disney India. He is the first-ever media and entertainment executive in India to lead a national industry chamber such as FICCI, which is India’s oldest industry body.
Mr Shankar presently leads Disney’s direct-to-consumer business in over 30 countries. He has been credited with the creation of pathbreaking entertainment shows and bringing world-class sports broadcasting to India. He also envisioned the digital transformation of Star by creating Hotstar, which has now expanded globally as Disney+ Hotstar.
In addition to his leadership at Disney and Star, Mr Shankar has played a key role in shaping the growth trajectory of the media and entertainment sector in India, to benefit industry stakeholders as well as consumers. He has been at the forefront of landmark initiatives in television broadcasting, such as self-regulation of content and digitization of the broadcasting sector. He has earlier been the President of the Indian Broadcasting Foundation (IBF) and the Chairman of FICCI’s Media and Entertainment Committee.
A trained journalist, Mr Shankar also pioneered the development of the television news ecosystem in India. Prior to Star India, he was the CEO and Editor of Star News, the country’s first 24-hour news channel. He has also been the Editor and News Director at TV Today Group, where he spearheaded the launch of Aaj Tak in 2000 and Headlines Today in 2003. Mr Shankar holds an MPhil in Economic History from the Jawaharlal Nehru University, Delhi.