

NASA’s James Webb Space Telescope has captured the first clear evidence for carbon dioxide in the atmosphere of a planet outside the solar system. This observation of a gas giant planet orbiting a Sun-like star 700 light-years away provides important insights into the composition and formation of the planet. The finding, accepted for publication in Nature, offers evidence that in the future Webb may be able to detect and measure carbon dioxide in the thinner atmospheres of smaller rocky planets.
WASP-39 b is a hot gas giant with a mass roughly one-quarter that of Jupiter (about the same as Saturn) and a diameter 1.3 times greater than Jupiter. Its extreme puffiness is related in part to its high temperature (about 1,600 degrees Fahrenheit or 900 degrees Celsius). Unlike the cooler, more compact gas giants in our solar system, WASP-39 b orbits very close to its star – only about one-eighth the distance between the Sun and Mercury – completing one circuit in just over four Earth-days. The planet’s discovery, reported in 2011, was made based on ground-based detections of the subtle, periodic dimming of light from its host star as the planet transits, or passes in front of the star.
Previous observations from other telescopes, including NASA’s Hubble and Spitzer space telescopes, revealed the presence of water vapor, sodium, and potassium in the planet’s atmosphere. Webb’s unmatched infrared sensitivity has now confirmed the presence of carbon dioxide on this planet as well.

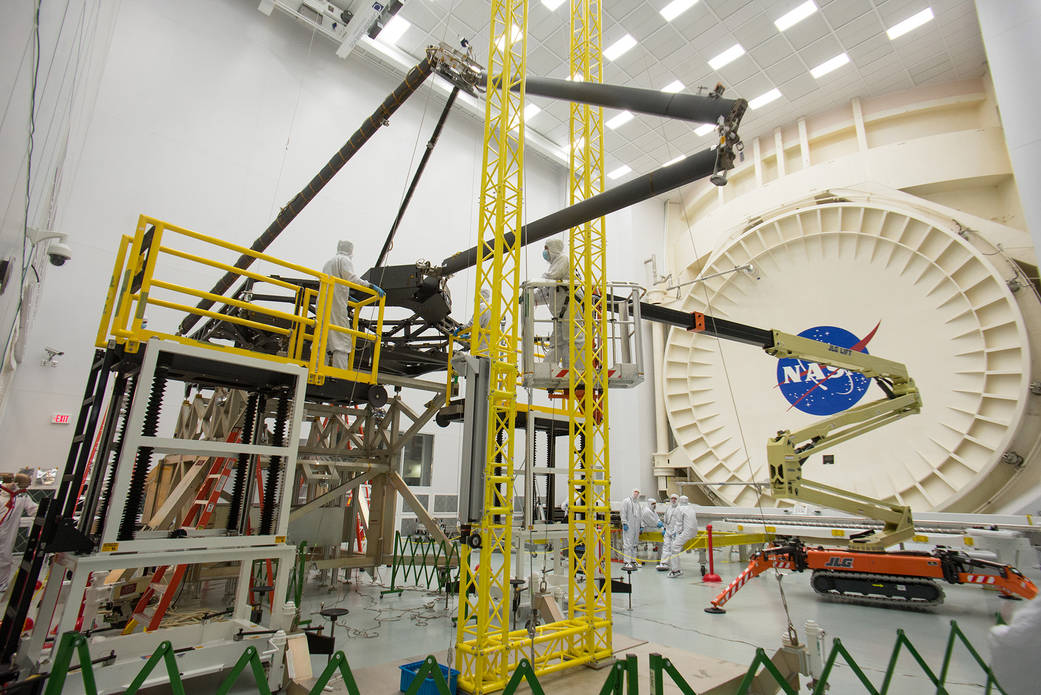
NASA Prepares Webb Telescope /NASA
Filtered Starlight
Transiting planets like WASP-39 b, whose orbits we observe edge-on rather than from above, can provide researchers with ideal opportunities to probe planetary atmospheres.
During a transit, some of the starlight is eclipsed by the planet completely (causing the overall dimming) and some is transmitted through the planet’s atmosphere.
Because different gases absorb different combinations of colors, researchers can analyze small differences in brightness of the transmitted light across a spectrum of wavelengths to determine exactly what an atmosphere is made of. With its combination of inflated atmosphere and frequent transits, WASP-39 b is an ideal target for transmission spectroscopy.
First Clear Detection of Carbon Dioxide
The research team used Webb’s Near-Infrared Spectrograph (NIRSpec) for its observations of WASP-39b. In the resulting spectrum of the exoplanet’s atmosphere, a small hill between 4.1 and 4.6 microns presents the first clear, detailed evidence for carbon dioxide ever detected in a planet outside the solar system.
“As soon as the data appeared on my screen, the whopping carbon dioxide feature grabbed me,” said Zafar Rustamkulov, a graduate student at Johns Hopkins University and member of the JWST Transiting Exoplanet Community Early Release Science team, which undertook this investigation. “It was a special moment, crossing an important threshold in exoplanet sciences.”
No observatory has ever measured such subtle differences in brightness of so many individual colors across the 3 to 5.5-micron range in an exoplanet transmission spectrum before. Access to this part of the spectrum is crucial for measuring abundances of gases like water and methane, as well as carbon dioxide, which are thought to exist in many different types of exoplanets.
“Detecting such a clear signal of carbon dioxide on WASP-39 b bodes well for the detection of atmospheres on smaller, terrestrial-sized planets,” said Natalie Batalha of the University of California at Santa Cruz, who leads the team.
Understanding the composition of a planet’s atmosphere is important because it tells us something about the origin of the planet and how it evolved. “Carbon dioxide molecules are sensitive tracers of the story of planet formation,” said Mike Line of Arizona State University, another member of this research team. “By measuring this carbon dioxide feature, we can determine how much solid versus how much gaseous material was used to form this gas giant planet. In the coming decade, JWST will make this measurement for a variety of planets, providing insight into the details of how planets form and the uniqueness of our own solar system.”