- Transaction volume surges nearly 12,000-fold in last 10 years, Value exceeds ₹314 lakh crore in FY 2025–26, reflecting deep nationwide adoption.
- Over 700 banks onboarded as UPI captures nearly 49% of global real-time payments, driving high-frequency retail usage and inclusive digital growth.
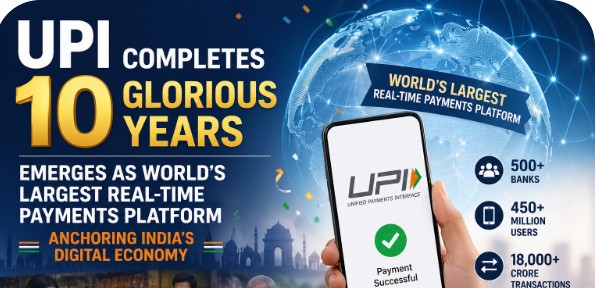
The Unified Payments Interface (UPI), launched on 11 April 2016 by the National Payments Corporation of India (NPCI) under the regulatory oversight of the Reserve Bank of India (RBI), has emerged as the backbone of India’s digital payments ecosystem and a critical driver of financial inclusion.
Over a decade of operations, UPI has demonstrated extraordinary scale and momentum. Annual transaction volume expanded from just 2 crore transactions in FY 2016-17 to over 24,162 crore transactions in FY 2025-26, representing an almost 12,000‑fold surge in transaction volume. Parallelly, transaction value rose sharply from ₹0.07 lakh crore in FY 2016-17 to approximately ₹314 lakh crore in FY 2025-26, translating into a more than 4,000‑fold increase in transaction value.
This simultaneous expansion in both volume and value highlights UPI’s deepening role in supporting high‑frequency retail payments. The unprecedented scale, reliability, and interoperability achieved by UPI have received global recognition, with the International Monetary Fund (IMF) acknowledging it as the world’s largest real‑time payment system by transaction volume, underscoring India’s leadership in building scalable, inclusive, and innovative digital public infrastructure.
| INDIA CELEBRATES 10 YEARS OF UPI
A Decade of Transforming India’s Digital Payment Landscape From 21 Banks & 0.01 Crore Transactions in a month in the Year 2016 to 700+ Banks & 2000+ crore Transactions in a month in the Year 2025 |
| 24,162 Crore
Annual Transactions (FY2026) |
₹314 Lakh Crore
Annual Value (FY2026) |
66 Crore
Daily Average Transactions |
₹0.86 Lakh Crore
Daily Average Value (FY2026) |
I. The Decade in Numbers
| UPI AT A GLANCE : KEY STATISTICS (NPCI) | |
| Annual Transaction Volume (FY2025-26) | 24,161.69 Crore |
| Annual Transaction Value (FY2025-26) | ₹314 Lakh Crore |
| YoY Volume Growth (2025-2026) | 30.0% |
| YoY Value Growth (2025-2026) | 20.59% |
| Daily Average Transactions (2025) | 66 Crore |
| Record Monthly Volume (March 2026) | 2264 Crore (peak) |
| Record Monthly Value (March 2026) | ₹29.53 Lakh Crore |
| Banks Live on UPI (As on March 2026) | 703 Banks |
| Banks at Launch (April 2016) | 21 Banks |
| First Month Transactions (April 2016) | 373 |
| Share of UPI in India’s Digital Payments | 85% (FY2025-26) |
| Share of Global Real-Time Volume | 49% of World (2025) |
| Countries Accepting UPI | 8 Countries |
Annual Transaction Volume Growth (2016-2025)
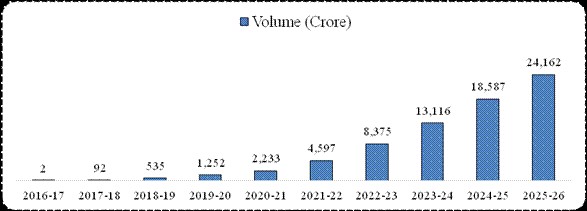
Fig 1: UPI Annual Transaction Volume in Crore|
Annual Transaction Value Growth (2016-2025)
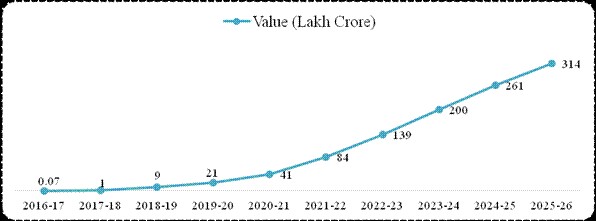
Fig 2: UPI Annual Transaction Value in ₹ Lakh Crore
II. Monthly Performance, 2025
The Year 2025 marked a significant milestone in the growth trajectory of the Unified Payments Interface (UPI). Monthly transaction volumes crossed 2,000 crore transactions for the first time in August 2025, reaching 2,001 crore transactions, signalling a new scale of adoption. This momentum continued through the remainder of the year, with December 2025 recording 2,163 crore transactions, the highest monthly transaction volume in UPI’s decade‑long journey.
Over the course of the calendar year 2025, UPI processed approximately 22,000 crore transactions in total, translating into a daily average of about 60 crore transactions. This sustained high‑frequency usage reflects the deep penetration of digital payments across the country and the growing trust of citizens, merchants, and businesses in India’s digital payments ecosystem.
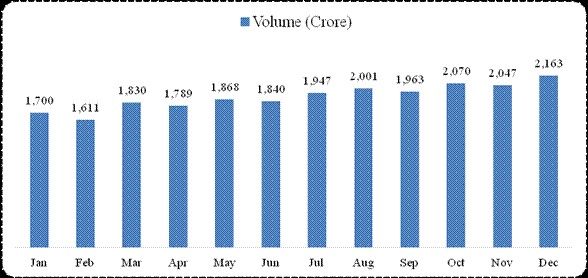
Fig 3: UPI Monthly Transaction Volume (2025)
III. Ecosystem Strength, Banks, Apps & Geography
Banks Live on UPI, Unprecedented Participation
The Unified Payments Interface (UPI) has witnessed a steady and broad-based expansion in institutional participation since its launch. The number of banks live on UPI increased from 44 banks in FY 2016-17, the first year of operations, to 703 banks by FY 2025-26. This onboarding covers public sector banks, private banks, small finance banks, payment banks, and cooperative banks, enabling UPI’s deep geographic reach. Each bank functions as a Remitter PSP (processing outgoing transactions) and/or a Beneficiary PSP (receiving funds), with NPCI monitoring performance metrics for all participants.
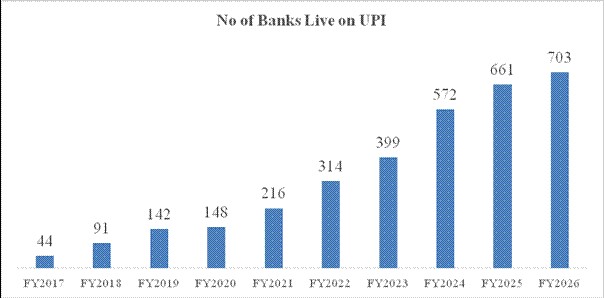
Fig 4: Number of Banks Live on UPI (FY2017–2026)
IV. Transaction Segmentation, P2P & P2M Analysis
An analysis of UPI transactions highlights a clear divergence between volume and value across payment types. Person‑to‑merchant (P2M) transactions account for 63% of total transaction volume, reflecting UPI’s extensive use for high‑frequency, low‑value retail payments. In contrast, person‑to‑person (P2P) transactions dominate transaction value, contributing 71%, indicating their use for higher‑ticket transfers between individuals. This contrast underscores UPI’s dual role as a mass retail payments platform and a trusted channel for larger‑value fund transfers.
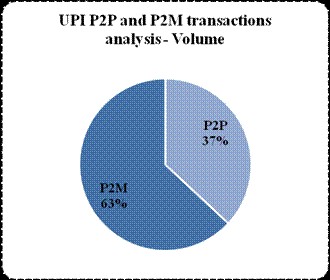
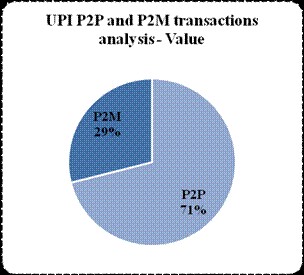
Fig 7: UPI P2P vs P2M Split — Volume & Value (H1 2025, 106.36 Billion Transactions) | Source: NPCI UPI Product Statistics
Transaction Distribution by Ticket Size, Micro-Payments Dominate
Fig 5: UPI P2P vs P2M Split, Volume & Value
In FY2026, UPI transactions totalling 24,162 crore reflected the platform’s deep integration into everyday digital payment usage across the country. with particularly robust momentum in the merchant segment. P2M transactions were largely driven by small-ticket payments, with 86% below ₹500, highlighting UPI’s deep integration into routine retail and day-to-day commerce, even as higher-value transactions continued to expand. P2P transactions also showed widespread usage for low-value transfers (59% below ₹500), while a significant 41% of transactions above ₹500 reflects UPI’s growing versatility in facilitating both regular personal payments and higher-value fund transfers.
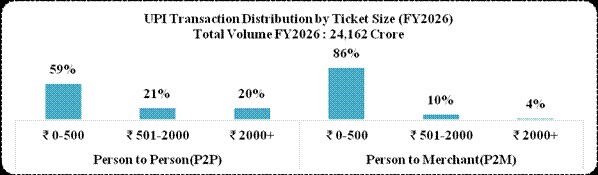


Fig 6: UPI transaction distribution by ticket size
V. UPI on the World Stage
What began as a domestic payments innovation has today evolved into a global benchmark in digital payments.
As of 2024, India’s Unified Payments Interface (UPI) accounts for nearly 49 % percent of the world’s real-time payment transaction volume, a milestone recognized by the International Monetary Fund (IMF) in its report in June 2025.
With over 66 crores transactions processed daily, UPI has surpassed global payment network, reinforcing India’s position as the world leader in instant, secure, and inclusive digital payments.
| Country / Region | Status |
| UAE | Operational, accepted at major merchant points; used by Indian diaspora |
| Singapore | Operational, linked with Singapore’s PayNow for cross-border transfers |
| France | Operational, expanding Indian tourist payment acceptance |
| Bhutan | Operational, NPCI-enabled real-time cross-border payments |
| Nepal | Operational, accepted across the nation |
| Sri Lanka | Operational, Indian visitor and diaspora payments |
| Mauritius | Operational, integrated with local payment infrastructure |
| Qatar | Operational. |
VI. The Road Ahead, UPI’s Next Decade
The next decade of UPI is poised to drive even greater transformation in India’s digital payments landscape. By bringing new users and merchants to the UPI Ecosystem, Government of India remains committed to enabling the next phase of UPI-led innovation and strengthening India’s digital payments ecosystem through continued policy support, technological advancement, and greater financial inclusion.
Also Read:
Almost every Indian village now has a banking outlet within 5 km radius. What changed?