A recent study has examined whether some of the universe’s smallest galaxies—particularly dwarf spheroidal galaxies orbiting the Milky Way—could host black holes, offering fresh insight into how these cosmic objects form and evolve over time.
While supermassive black holes are commonly found at the centres of large galaxies, detecting them in dwarf spheroidal galaxies remains far more difficult. These smaller systems are faint, contain little gas, and are heavily dominated by dark matter, making direct observation of any central black hole a significant challenge.
The question is closely tied to broader mysteries about the origins of the first black holes, their growth in low-mass environments, and whether established relationships—such as the link between black hole mass and stellar velocity dispersion—hold true even in the smallest galaxies. Understanding this connection is key to building a consistent picture of galaxy evolution across cosmic history.
Researchers K. Aditya and Arun Mangalam of the Indian Institute of Astrophysics developed detailed dynamical models of dwarf spheroidal galaxies, incorporating stars, dark matter, and a possible central black hole. By analysing stellar motion using high-quality kinematic data, they were able to place constraints on the mass of any black holes that might exist in these systems.
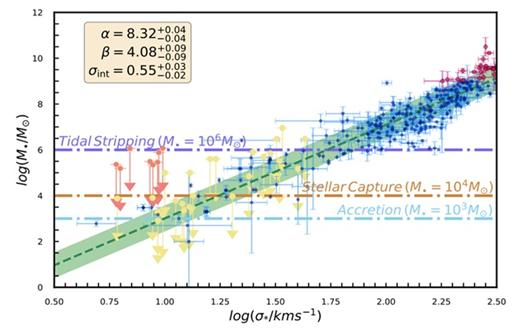
Their approach accounted for stellar anisotropy—variations in stellar velocities along different directions—allowing for more realistic modelling of galaxy structures. Applying this framework to a representative sample, the researchers derived strong upper limits on black hole masses, generally below one million solar masses, with some galaxies permitting only significantly smaller values.
The findings suggest that while large black holes are not required to explain the data, the presence of intermediate-mass black holes remains plausible. By combining their results with existing observations, the team established a unified relationship between black hole mass and stellar velocity dispersion, spanning a wide range of galaxy sizes and black hole masses.

The study also compared observational constraints with theoretical growth models. Mechanisms such as momentum-driven gas accretion and stellar capture were found to produce black holes with masses consistent with the observed limits. Additionally, the researchers considered scenarios in which dwarf galaxies may have once been larger systems that lost mass through interactions with the Milky Way.
The work carries significant implications for both theoretical models and future observations. It provides a crucial benchmark for simulations of galaxy and black hole evolution, particularly as next-generation facilities like the proposed National Large Optical Telescope and the Extremely Large Telescope come into focus.
With improved observational capabilities on the horizon, astronomers are expected to gain sharper insights into faint, low-mass galaxies. The framework established by this study offers a foundation for interpreting such data and could play a key role in determining whether dwarf galaxies harbour primordial black hole seeds.
Paper link: https://iopscience.iop.org/article/10.3847/1538-4357/ae2d4f
Also Read:
What’s the longstanding tradition at JPL before any launch and other major space mission events
Astronomers Spot “Sneezing” Baby Stars Creating Massive Rings In Space